Track the overall performance of your Partners and Key Dates in a single place.
Dashboards offer a concise look at your company's performance by market, partner and product category. It also provides a snapshot of recent activity and important dates across all of your partner workspaces.
If you haven't created partner workspaces, view our guide on partner management in myCaribou.
- To view your company's Dashboard, click on the Dashboards tab
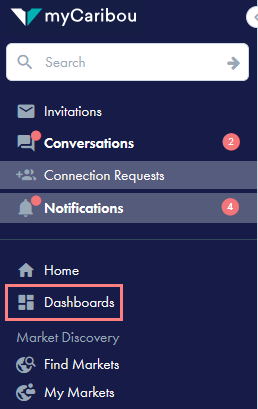
- You may filter your Dashboard by Year, Markets and Partners using the filters at the top of the dashboard.

Where does the data in my Dashboard come from?
- The data shown on your dashboard is pulled from all Active Workspaces where at least one user from your company is a member with Editor or Owner access.
- The Sales and Quarterly Business Review data comes from the Active Scorecards and Active Sales Plans in any of your Active Workspaces.
Performance
Through Dashboards you can track overall performance by Markets and by Partners
-
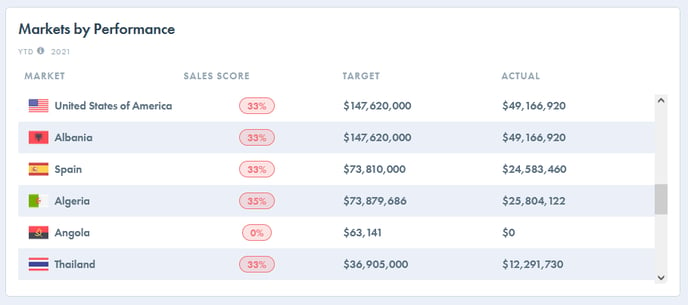
- The Markets table gives you a summary of all active sales plans associated with each market, comparing the year to date actual values versus the target values.
-
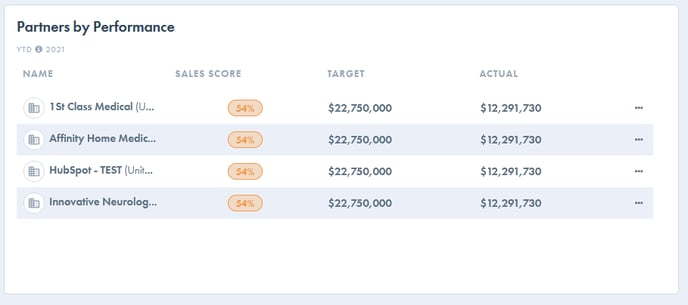
- The Partners table provides a summary of the active sales plans with each partner, comparing the year to date actual values versus the target values, but it is shown by partner.
-
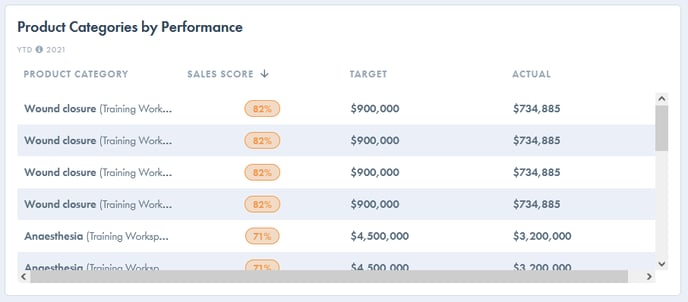
- The Product Categories table also provides a comparison of year to date actual values versus target values, but it's broken down by product category. These values will also pull from your active sales plans.
Sales Forecast
-
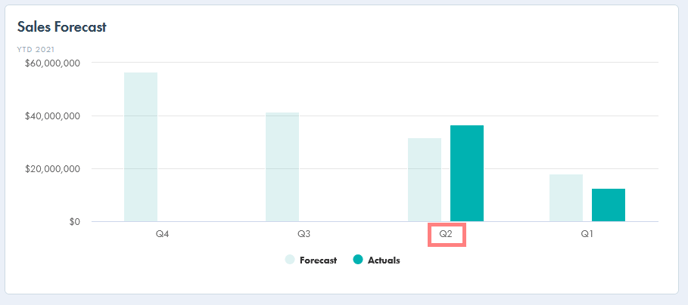
- The Sales Forecast table displays a general forecast of the sales planned in the active sales plan of each of your active workspaces.
-
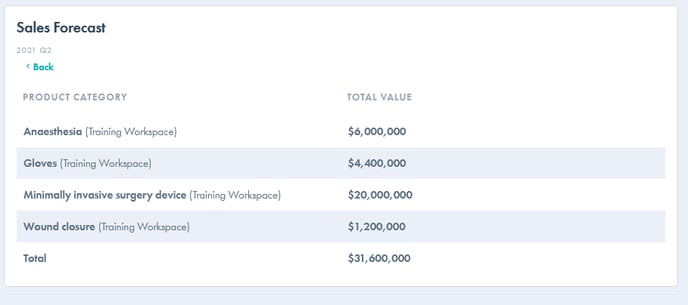
- By clicking each quarter, you'll see the detailed values for that quarter.
Recent Activity
-
- In this tab you will be able to check the most recent changes and events that took place across all of your workspaces.
Key Dates
-
- The Key Dates Calendar offers an overview of the events in each workspace calendar.
